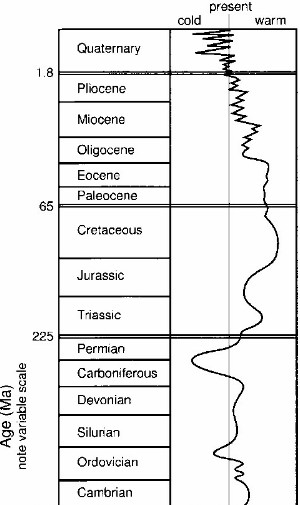
As the figure on the left shows, average temperature has been trending downward since the early Cretaceous period about 100 million years ago.
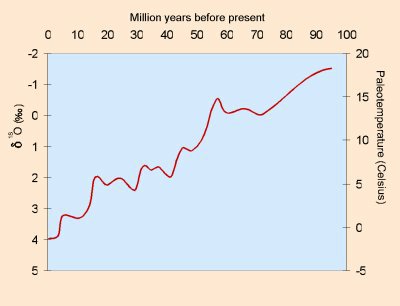
The figure below zooms in on that period, looking at the deep ocean temperature (derived from oxygen content).
|
|
The point to infer from this is that, geologically speaking, we have been on a downward temperature trend for 100 million years now, with deep water temperatures dropping 20 degrees celsius.
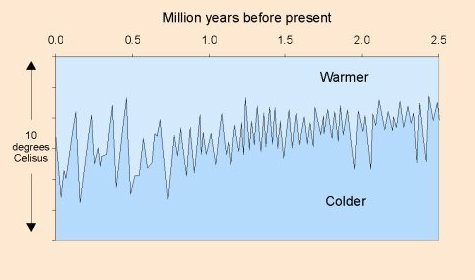
Now lets look at ocean temperatures over the last 2.5 million years. As the figure below shows, temperature continued to drift downward, but over the last 750,000 years began to be characterized by relatively dramatic swings in temperature between glacieration and relatively warm intermissions.
|
 Finally, we show the so-called 'hockey stick' graph, which shows an abrupt inflection in temperature. Based on the pattern of both the last 5 million years and of the last 100 million years, we would have expected a downward shift in temperature;
based on the duration of the current warm spell, we would have expected in some time within the next 2,000 years.
If this is a natural transition, it is remarkable both for its ubruptness and for the fact that it represents a breakout from a 100 million year trend.
Finally, we show the so-called 'hockey stick' graph, which shows an abrupt inflection in temperature. Based on the pattern of both the last 5 million years and of the last 100 million years, we would have expected a downward shift in temperature;
based on the duration of the current warm spell, we would have expected in some time within the next 2,000 years.
If this is a natural transition, it is remarkable both for its ubruptness and for the fact that it represents a breakout from a 100 million year trend.